Citrics.io
During my time at Lambda School us Data Science students were put to work in a cross functional team environment called Labs. I was put in a team of 4 Data Science students and 4 Web Development students. We were supposed to work together on a real world project that is accessible to the public called Citrics. Let me tell you, this project was the most stressful project I’ve ever had to do and it really challenged me on confidence in my skills. There were nights where I stayed up and try to polish on my current skills so that I can feel like I am able to contribute to the team.

What Is Citrics?
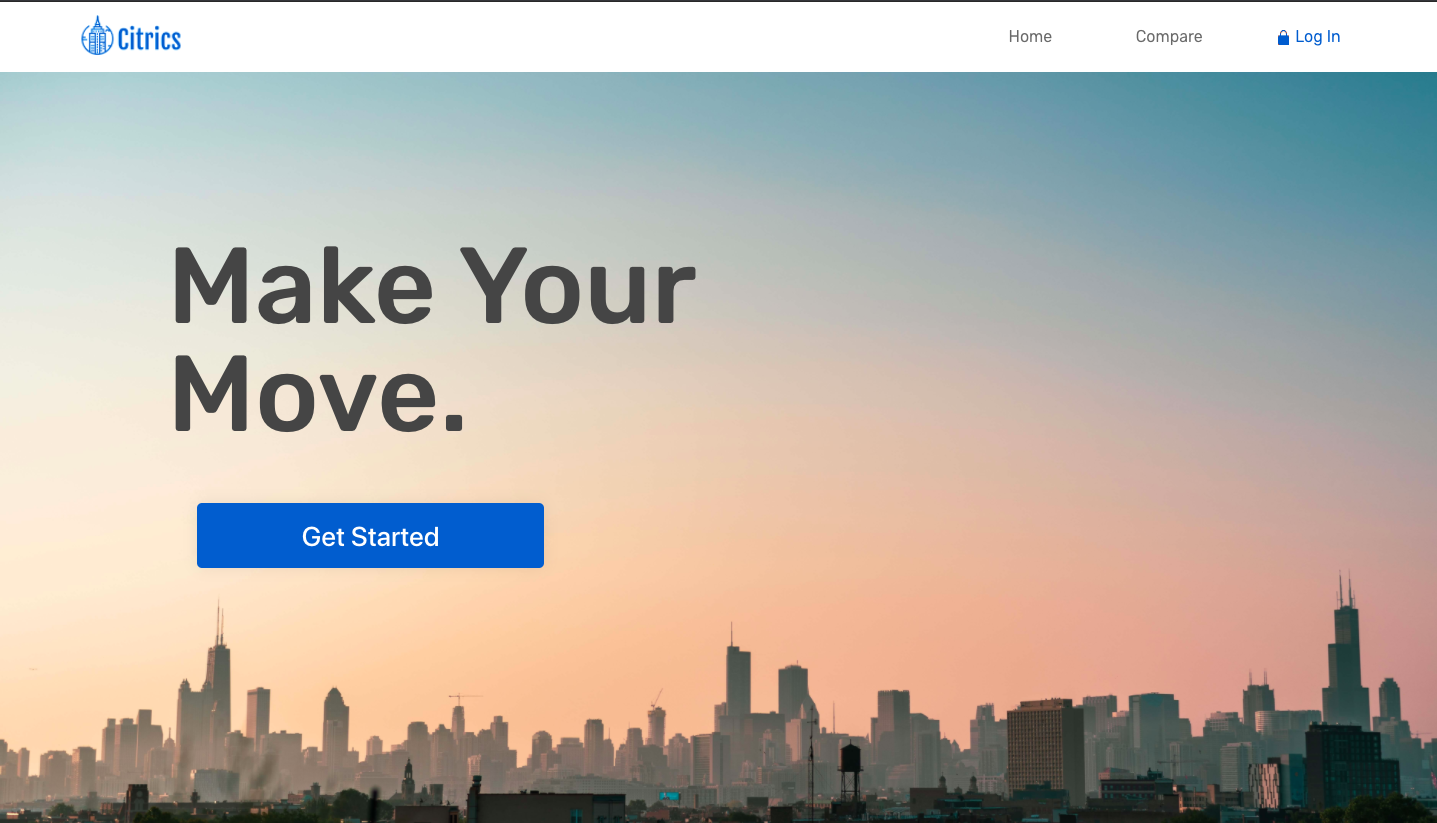
Citrics is a city data comparison website that offers information on over 30,000 cities the user would like to move to. You can compare up to 3 different cities at once, side by side all on one page. The purpose of this website was to help those who are trying to relocate to another city, but aren’t sure if it’ll fit their requirements. The user may look at the city’s rent, industry trend, the population, etc.
Contributions
During labs, my team and I implemented 3 of the biggest changes to Citrics. We wanted the user to see the forecast of Housing costs at each city for the next 2 years and we also applied that method to Industry Trends for those who are looking to switch jobs. We used FBProphet as a model to predict these trends a long with Plotly for visualizations. Our biggest addition was our recommendation system. We wanted to do a reverse user flow addition to the search option because there weren’t any Machine Learning throughout this website.
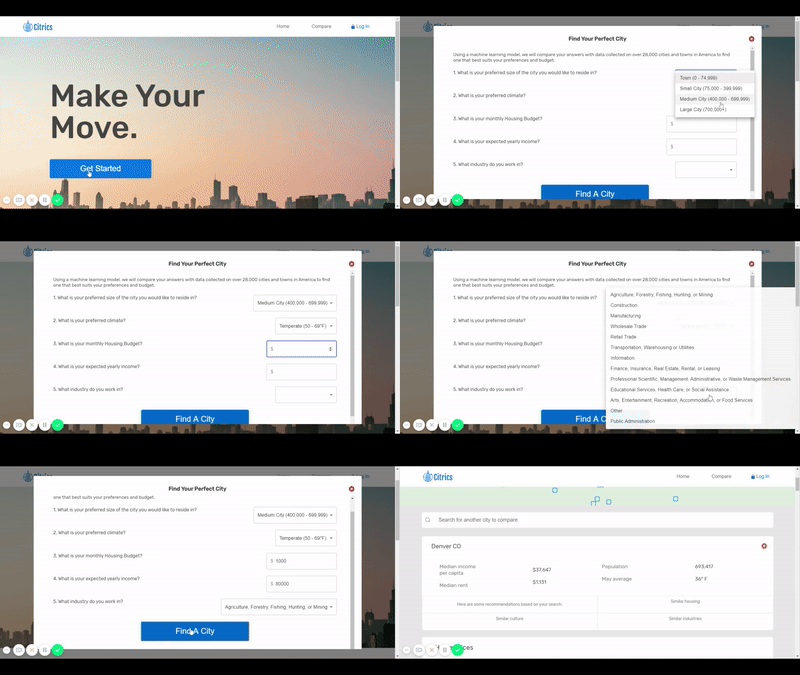
The recommendation system was generated by using a KNN model and pulling data directly from MongoDB. We decided to go with an unsupervised model during this implementation. We build this system with a specific user story in mind. We wanted to help the users out there that aren’t sure of which cities would suit them best, but do know what is important to them. The users would answer 5 questions in a short survey and the model will recommend 1 city to them based off their answers. Don’t worry about the 1 city because we had an additional recommendation model built onto the data card showing recommended city based off the data displayed on that card. For example, our first model recommended Boston, MA, then you can see on that data card it says, recommended for you based off similar rent, industry and population to Boston, MA.

Overall Thoughts
This project taught me what its like to work with a team of 7 different people. We had a lot of meetings and conflicted ideas, but in the end we all generated the perfect product showcasing our skills as one. Also, it’s pretty cool to see over 6 different algorithms on one page written by students.